Gold - Usd Dollar Analysis 22/01/2026
January 22, 2026
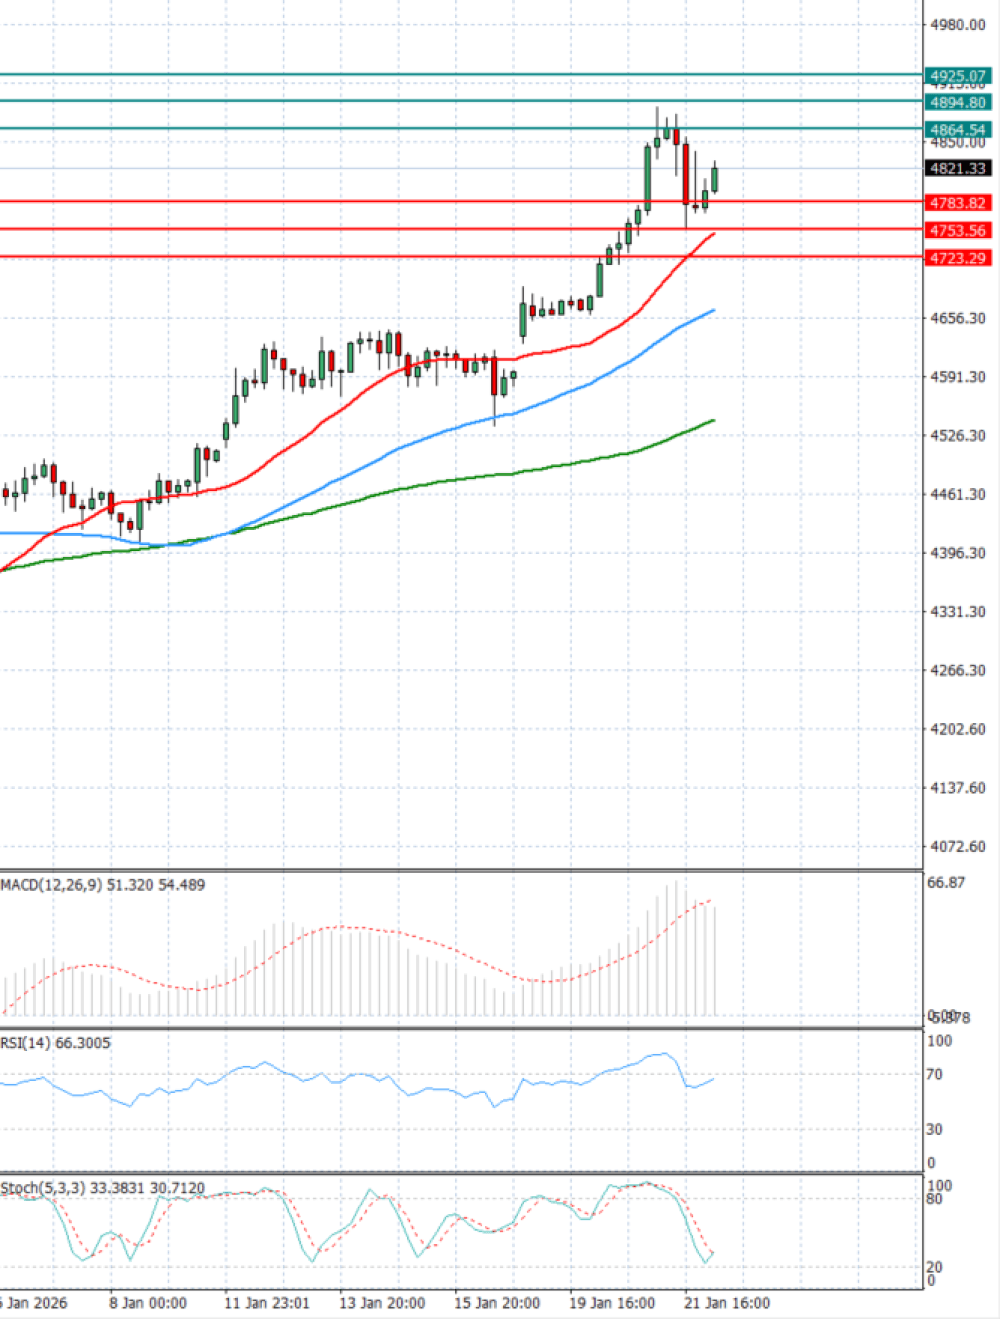
Technical analysis
Gold Support & Resistance Table - 2026-01-22
| Support & Resistance Table | Level | Explanation |
|---|---|---|
| Resistance 2 | 4894.80 | Daily R2 |
| Resistance 1 | 4864.54 | Daily R1 |
| Support 1 | 4783.82 | Daily R2 |
| Support 2 | 4753.56 | Daily R1 |
Gold Indicator Table - 2026-01-22
| Indicator | Signal |
|---|---|
| SMA 20 | BUY |
| SMA 50 | BUY |
| SMA 100 | BUY |
| MACD( 12;26;9) | BUY |
| RSI (14) | BUY |
| Stochastic ( 9;6;3) | BUY |
Gold Indicator / Period Table - 2026-01-22
| Indicator / Period | Day BUY | Week BUY | Month BUY |
|---|---|---|---|
| MACD( 12;26;9) | BUY | BUY | BUY |
| RSI (14) | BUY | BUY | BUY |
| SMA 20 | BUY | BUY | BUY |
Gold 2026-01-22 - Reference Price : 4824.18
| Status | Subject | SMS status | Indicators status |
|---|---|---|---|
| BUY | Simple Moving Average | Buy (3) | Sell (0) |
| BUY | Technical Indicators - Oscillators | Buy (3) | Sell (0) |
Fundamental analysis
Gold prices are trading in today’s Asian session below 4900 levels.
Gold prices fell on Thursday as geopolitical tensions and safe-haven demand eased after US President Trump backed away from tariff threats and proposals to take Greenland by force, while a stronger dollar also pressured prices. Meanwhile Goldman Sachs increased its gold forecast to $5,400.
GOLD (USD)
-0.19%
Trade Info
- Leverage1 : 20
- Margin0.05
- Premium Buy-90
- Premium Sell-12.08
- Unit Amount100
Open Economic calendar
4659.18
Day range
4967.5
37%
Sell
Market sentiment
Buy
63%